This tutorial demonstrates how to build a Pendulum system and measure it’s Period and Total Energy using Polytech’s SMART:Blox S5 STEM Set and the STEM LAB Windows application.
Method
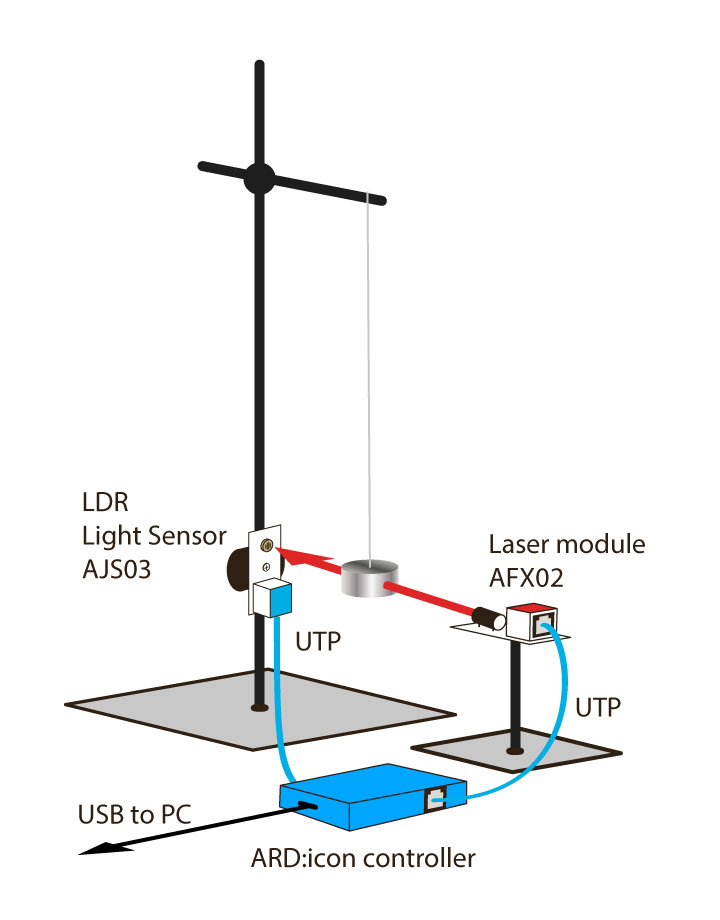
A Laser module and a Light sensor are placed directly oposite to each other so that the laser beam is completely alingned with the light sensor cell. A pendulum is placed between the sensor and the laser beam in such a way that the pendulum’s movement disturbs the continiuity of the laser beam, introducing lack-of-light intervals to the light sensor. Real-time measuring results are tracked and displayed on a connected Windows PC.
Equipment
- Hardware
- SMART:Blox S5 STEM Set
- ARD:icon controller
- Laser module AFX02
- LDR Light sensor AJS03
- UTP cables (x2)
- Pendulum apparatus
- SMART:Blox S5 STEM Set
- Software
- Polytech STEM LAB application on a Windows PC
Resources

Safety Notes
There are no special safety requirements for this experiment.
Set up Instructions
- Setup a pendulum system using a Pendulum Apparatus

- Attach and secure the LDR Light sensor AJS03 on an height-adjustable rod on the pendulum stand.
- Attatch and secure the Laser module AFX02 on a flat surface of some height.
- Adjust the height of the adjustable rod carrying the light sensor in such a way that, when the laser beam is on, it hits directly on the light sensor cell. Secure the rod in this position.
- Adjust the height of the pendulum, so that the pendulum mass, when in rest, blocks completely the laser beam from hitting the light sensor cell.

Connections
- Connect the Laser Module to the ARD:icon D9 Digital Input using a UTP cable.
- Connect the Light sensor to the ARD:icon A3 Analogue Input using another UTP cable.
- Use a USB cable to connect the ARD:icon to the Windows PC.
Usage Instructions
- Move the pendulum mass to start oscillating the pendulum
- Launch the Polytech STEM LAB application.
- Select “Arduino Pendulum” and press “Start Pendulum.”
- Observe the pendulum oscillations in real time on the computer screen.


Features and Options
- Swap between Graphs: use the tabs to swap between Freequency/Time graph and Energy/Time Graph.
- Real time readings: under the graph area you may see valuable readings about the system:
- Freequency
- Period (half/full)
- Velocity (current/max)
- Calculations: entering details about the pendulum’s mass width and weight, the SMART LAB application will also provide insights about the pendulum’s:
- Kinetic Energy
- Potential Energy
- Total Mechanical Energy
- Mass height
End of tutorial